2022
Sustainable Transit Research Guide
Research synthesis and data visualization for transit electrification
{research synthesis, data collection and analysis, information architecture, data visualization}
Overview
From a research report to an interactive guide
The Sustainable Development and Electrification of Transit project examined the environmental, economic, health, social, and technical dimensions of transit electrification.
As a research assistant with OCAD University’s Visual Analytics Lab, I worked with another research assistant under Dr. Sara Diamond to collect, organize, and analyze sources for the project. We developed an interactive guide to accompany the research report, giving readers a visual way to explore its literature, datasets, and research tools.


Research
Finding a structure across the sources
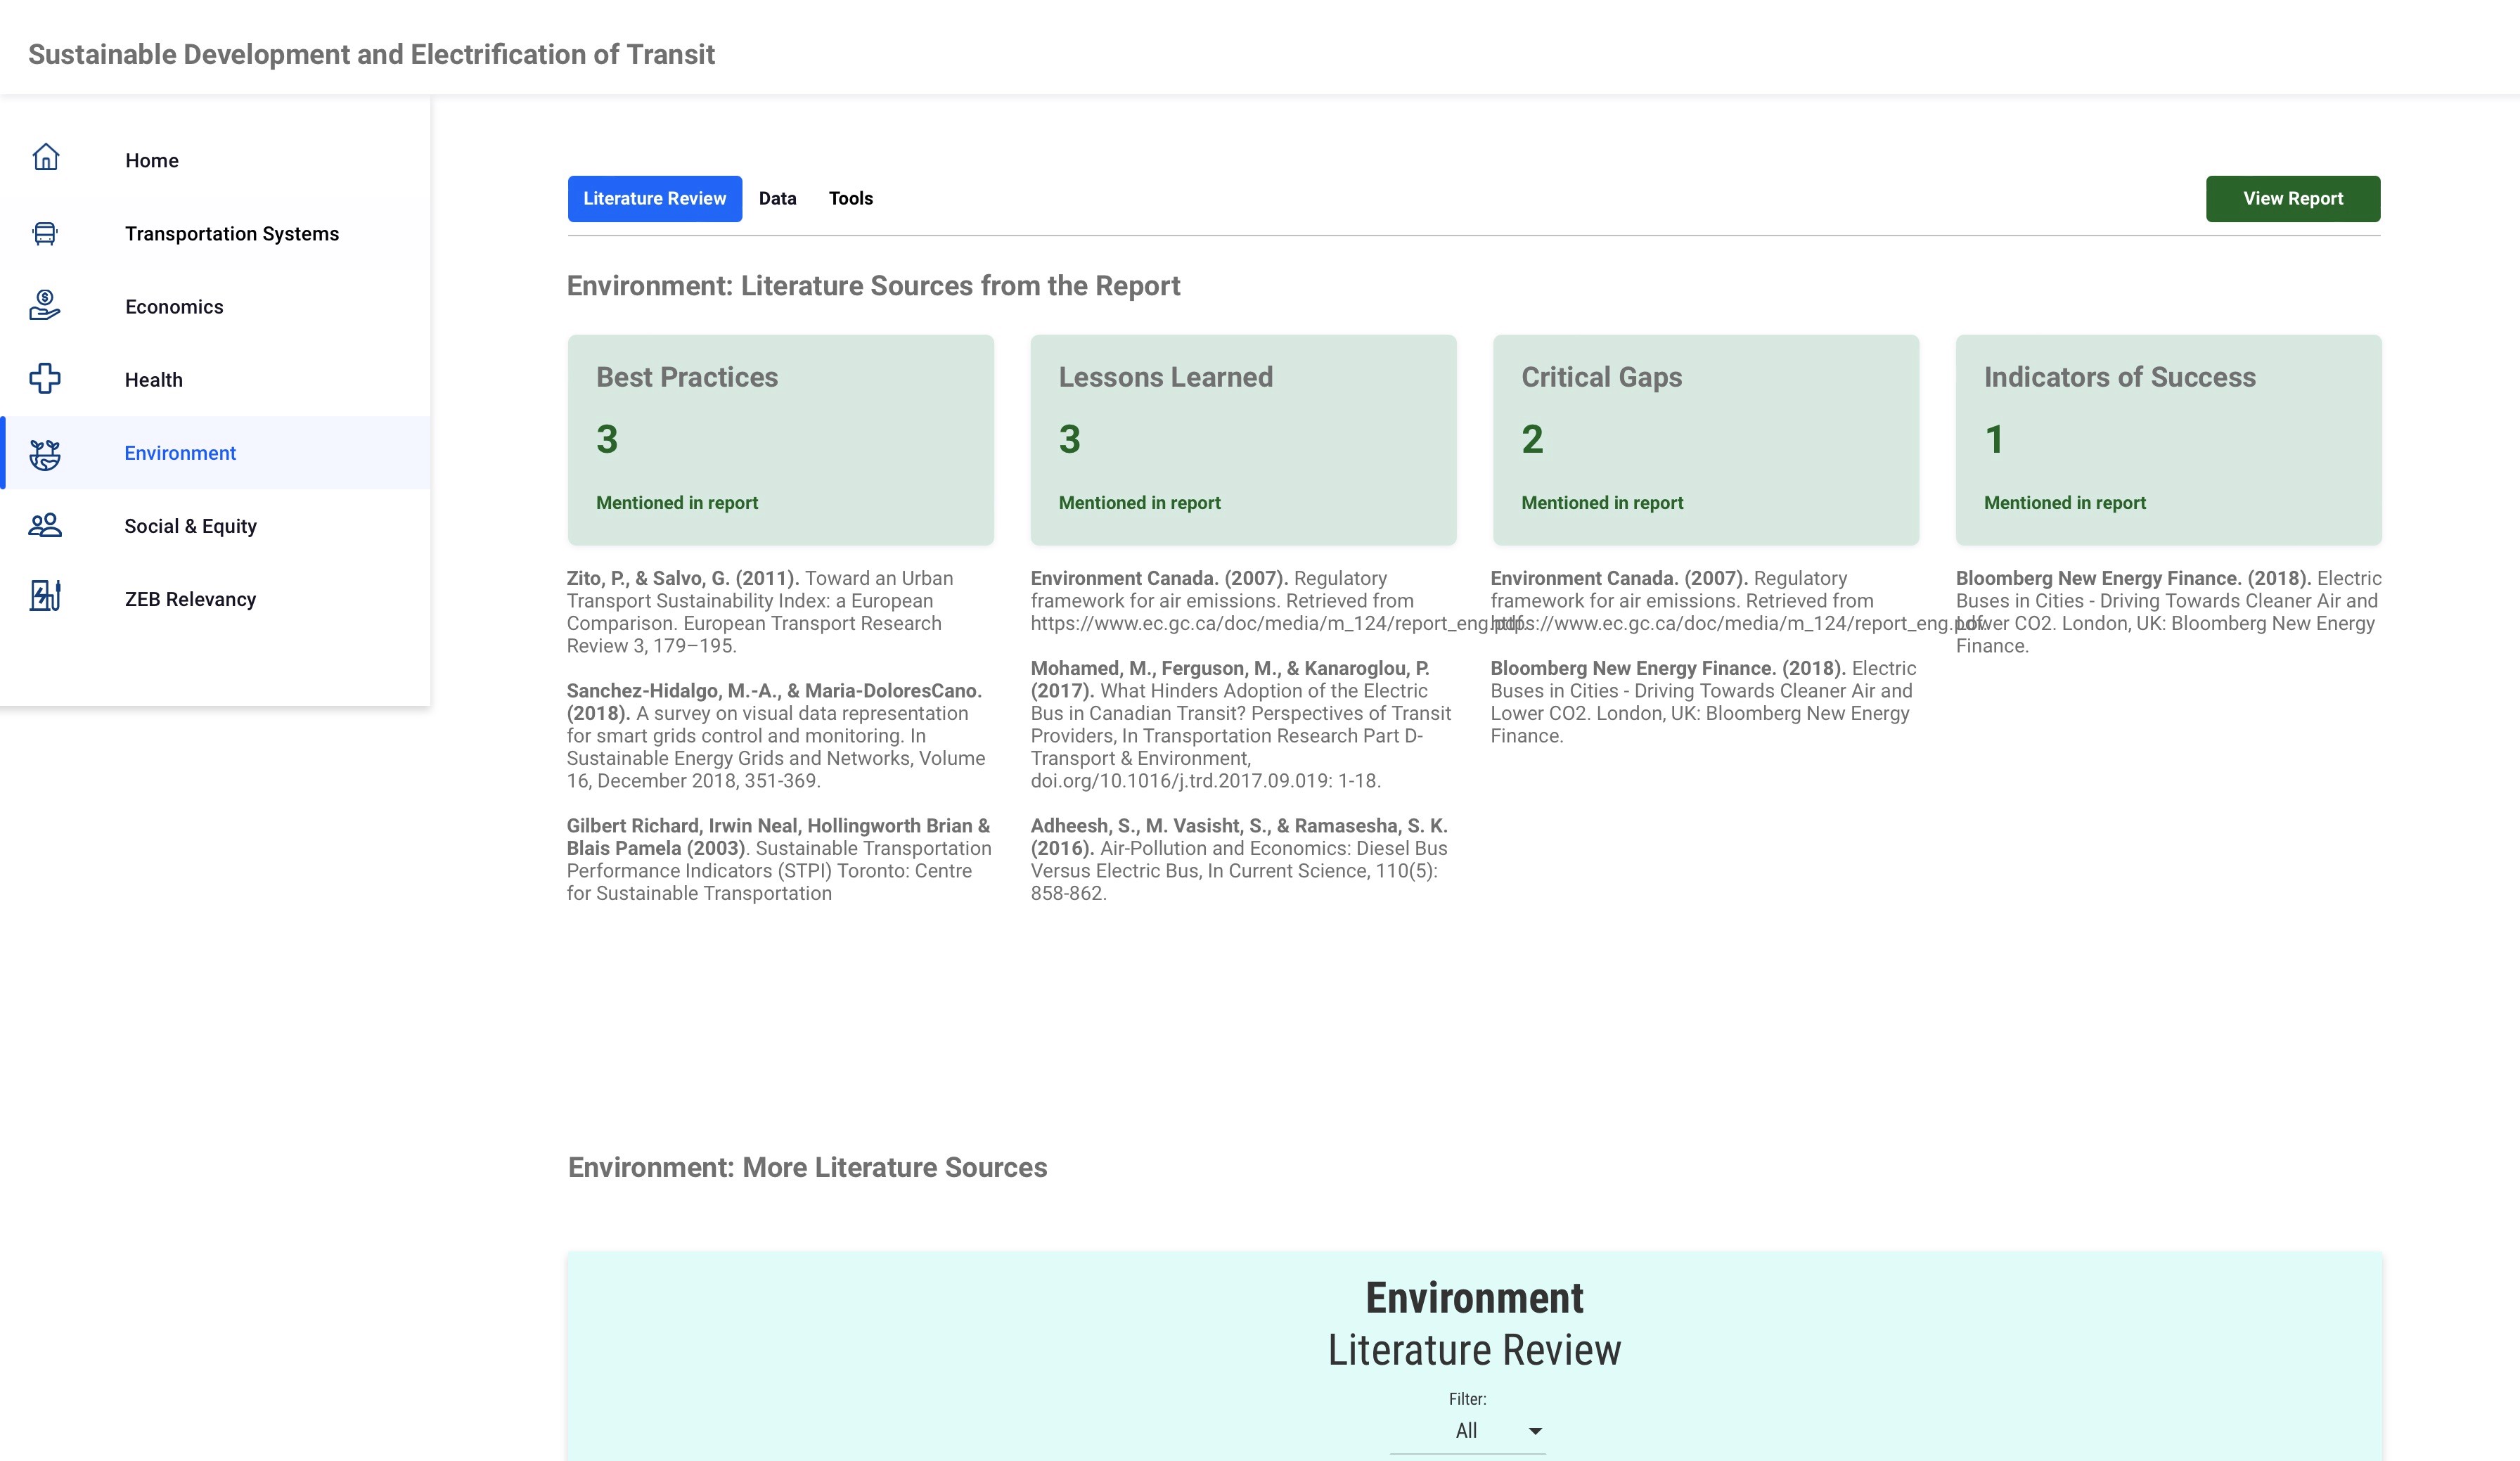
The collected material spanned literature, datasets, and toolsets from different areas of sustainable transportation. We reviewed and classified the sources, identifying six recurring themes: transportation systems, economics, health, environment, social and equity issues, and zero-emission bus relevance.
These themes created a shared structure across the different source types and became the foundation for the website’s sitemap and navigation.
Interactive Guide
Moving from research themes to individual sources
Visitors begin with one of the six research themes and then narrow the material by literature, data, or tools. Each area connects sources from the report with additional resources and interactive Flourish visualizations.
The repeated page structure keeps this layered collection consistent across the guide, while linked citations allow visitors to continue into the original research. The final website was published as an interactive companion to the project report.

Explore the visualizations by filtering the research and selecting categories to reveal individual sources:


